Question # 1
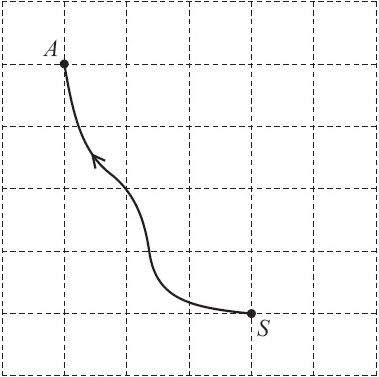
The diagram shows the map of part of an orienteering course.
Sanji runs from the start, S, to the point A.
Write SA as a column vector.
Solution
As Sanji runs 3 units in the left (-ve) direction and 4 units in the upward (+ve) direction. So the column vector is
Question # 2
When Ali takes a penalty, the probability that he will score a goal is 4/5.
Ali takes 30 penalties.
Find how many times he is expected to score a goal.
Solution
| No. of times, Ali is expected to goal = |
4 |
x 30 = 24 |
| 5 |
24 times he is expected to score a goal.
Question # 3
The ratio of Anne’s height : Ben’s height is 7 : 9.
Anne’s height is 1.4 m.
Find Ben’s height.
Solution
| Anne's height |
= |
7 |
| Ben's height |
9 |
| Ben's height = |
9 |
x 1.4 =
1.8 |
| 7 |
Ben's height = 1.8 m
Question # 4
The distance between the centres of two villages is 8 km.
A map on which they are shown has a scale of 1 : 50 000.
Calculate the distance between the centres of the two villages on the map.
Give your answer in centimetres.
Solution
According to the map scale, 1 centimetre = 500 metre = 50000 centimetres
and we know that 8 kilometre = 800000 centimetres
| Distance between two villages on map |
= |
Scale distance on map |
| Actual distance between two villages |
Actual distance |
| Distance between two villages on map |
= |
1 |
| 800000 |
50000 |
| Distance between two villages on map = |
1 |
x 800000 =
16 |
| 50000 |
Distance between two villages on map = 16 centimetres
Question # 5
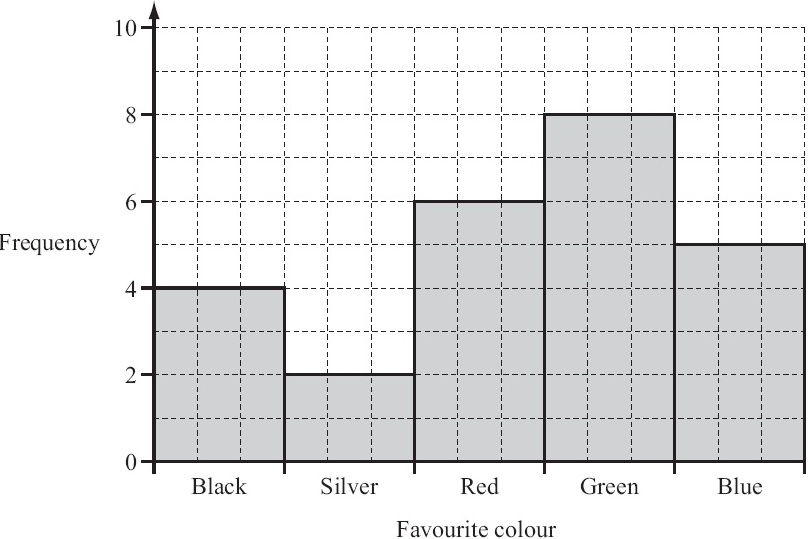
The bar chart shows the favourite colours of students in a class.
(a) How many students are in the class?
(b) Write down the modal colour.
Solution
(a) From bar chart, frequency against each colour represents the no. of students.
By adding these frequencies, we have, 4 + 2 + 6 + 8 + 5 = 25
Hence the no. of students in the class = 25
(b) The modal colour is green, having the highest frequency.
Question # 6
Use your calculator to find
Solution
Question # 7
(a) Calculate 60% of 200.
(b) Write 0.36 as a fraction.
Give your answer in its lowest terms.
Solution
(a)
(b)
Question # 8
A circle has a radius of 50 cm.
(a) Calculate the area of the circle in cm2.
(b) Write your answer to part (a) in m2.
Solution
(a)
Radius of the circle = 50 cm
| Area of the circle = p r2 |
| Area of the circle = 3.142 x 502 = 7855 |
| Area of the circle = 7855 cm2 |
(b)
As 1 m = 100 cm
| Area of the circle = 7855 x ( |
1 |
)2 m2 |
| 100 |
| Area of the circle = |
7855 |
m2 |
| 10000 |
| Area of the circle = 0.7855 m2 |
Question # 9
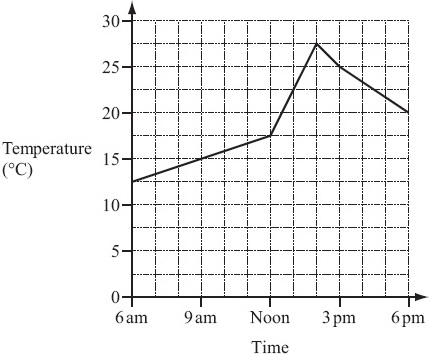
The graph shows the temperature in Paris from 6 am to 6 pm one day.
(a) What was the temperature at 9 am?
(b) Between which two times was the temperature decreasing?
(c) Work out the difference between the maximum and minimum temperatures shown.
Solution
(a)
The temperature at 9 am is 15 oC
(b)
Between 2 pm and 6pm, the temperature was decreasing.
(c)
From graph,
| the maximum temperature = 27.5 oC |
| the minimum temperature = 12.5 oC |
Difference between maximum and minimum temperatures
Question # 10
(a) Write down the mathematical name of a quadrilateral that has exactly two lines of symmetry.
(b) Write down the mathematical name of a triangle with exactly one line of symmetry.
(c) Write down the order of rotational symmetry of a regular pentagon.
Solution
(a)
Rectangle or rhombus
(b)
Isosceles (triangle)
(c)
5
Question # 11
Without using your calculator, work out
Show all your working clearly and give your answer as a fraction.
Solution
Question # 12
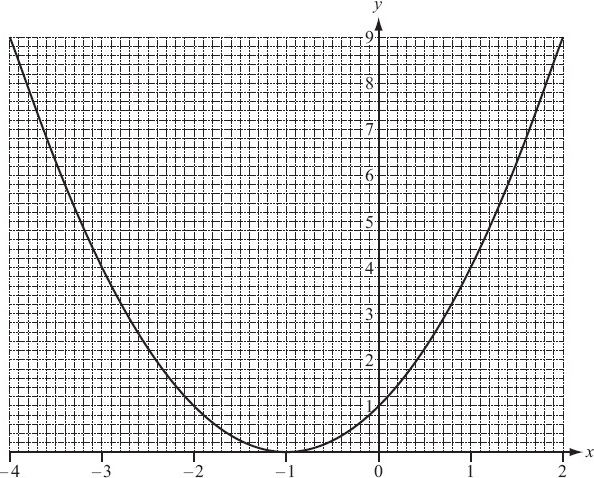
The diagram shows the graph of y = (x + 1)2 for −4 ≤ x ≤ 2.
(a) On the same grid, draw the line y = 3.
(b) Use your graph to find the solutions of (x + 1)2 = 3.
Give each solution correct to 1 decimal place.
Question # 13
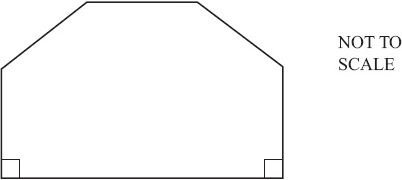
The front of a house is in the shape of a hexagon with two right angles.
The other four angles are all the same size.
Calculate the size of one of these angles.
Question # 14
(a) Expand and simplify.
(b) Expand.
Solution
(a)
(b)
Question # 15
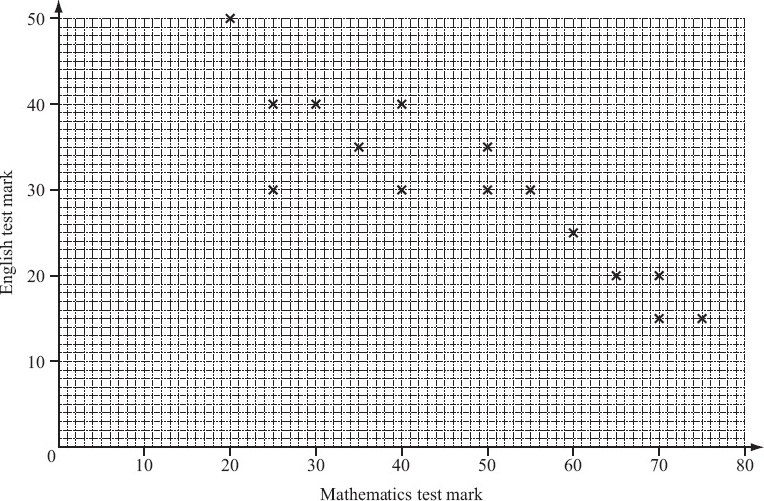
The scatter diagram shows the marks obtained in a Mathematics test and the marks obtained in an
English test by 15 students.
(a) Describe the correlation.
(b) The mean for the Mathematics test is 47.3 .
The mean for the English test is 30.3 .
Plot the mean point (47.3, 30.3) on the scatter diagram above.
(c) (i) Draw the line of best fit on the diagram above.
(ii) One student missed the English test.
She received 45 marks in the Mathematics test.
Use your line to estimate the mark she might have gained in the English test.
Question # 16
(a)
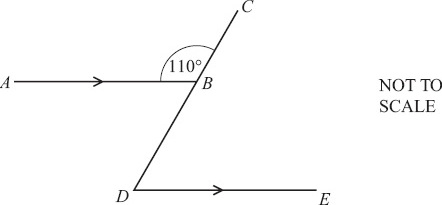
In the diagram, AB is parallel to DE.
Angle ABC = 110°.
Find angle BDE.
(b)
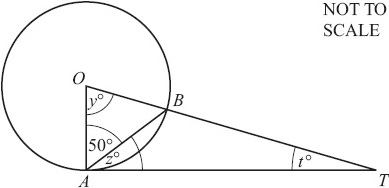
TA is a tangent at A to the circle, centre O.
Angle OAB = 50°.
Find the value of
(i) y,
(ii) z,
(iii) t.
Question # 17
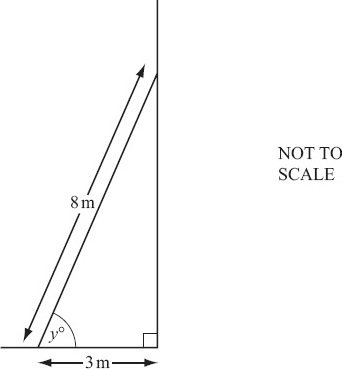
The diagram shows a ladder, of length 8 m, leaning against a vertical wall.
The bottom of the ladder stands on horizontal ground, 3 m from the wall.
(a) Find the height of the top of the ladder above the ground.
(b) Use trigonometry to calculate the value of y.
Question # 18
(a) Lucinda invests $500 at a rate of 5% per year simple interest.
Calculate the interest Lucinda has after 3 years.
(b) Andy invests $500 at a rate of 5% per year compound interest.
Calculate how much more interest Andy has than Lucinda after 3 years.